Axes
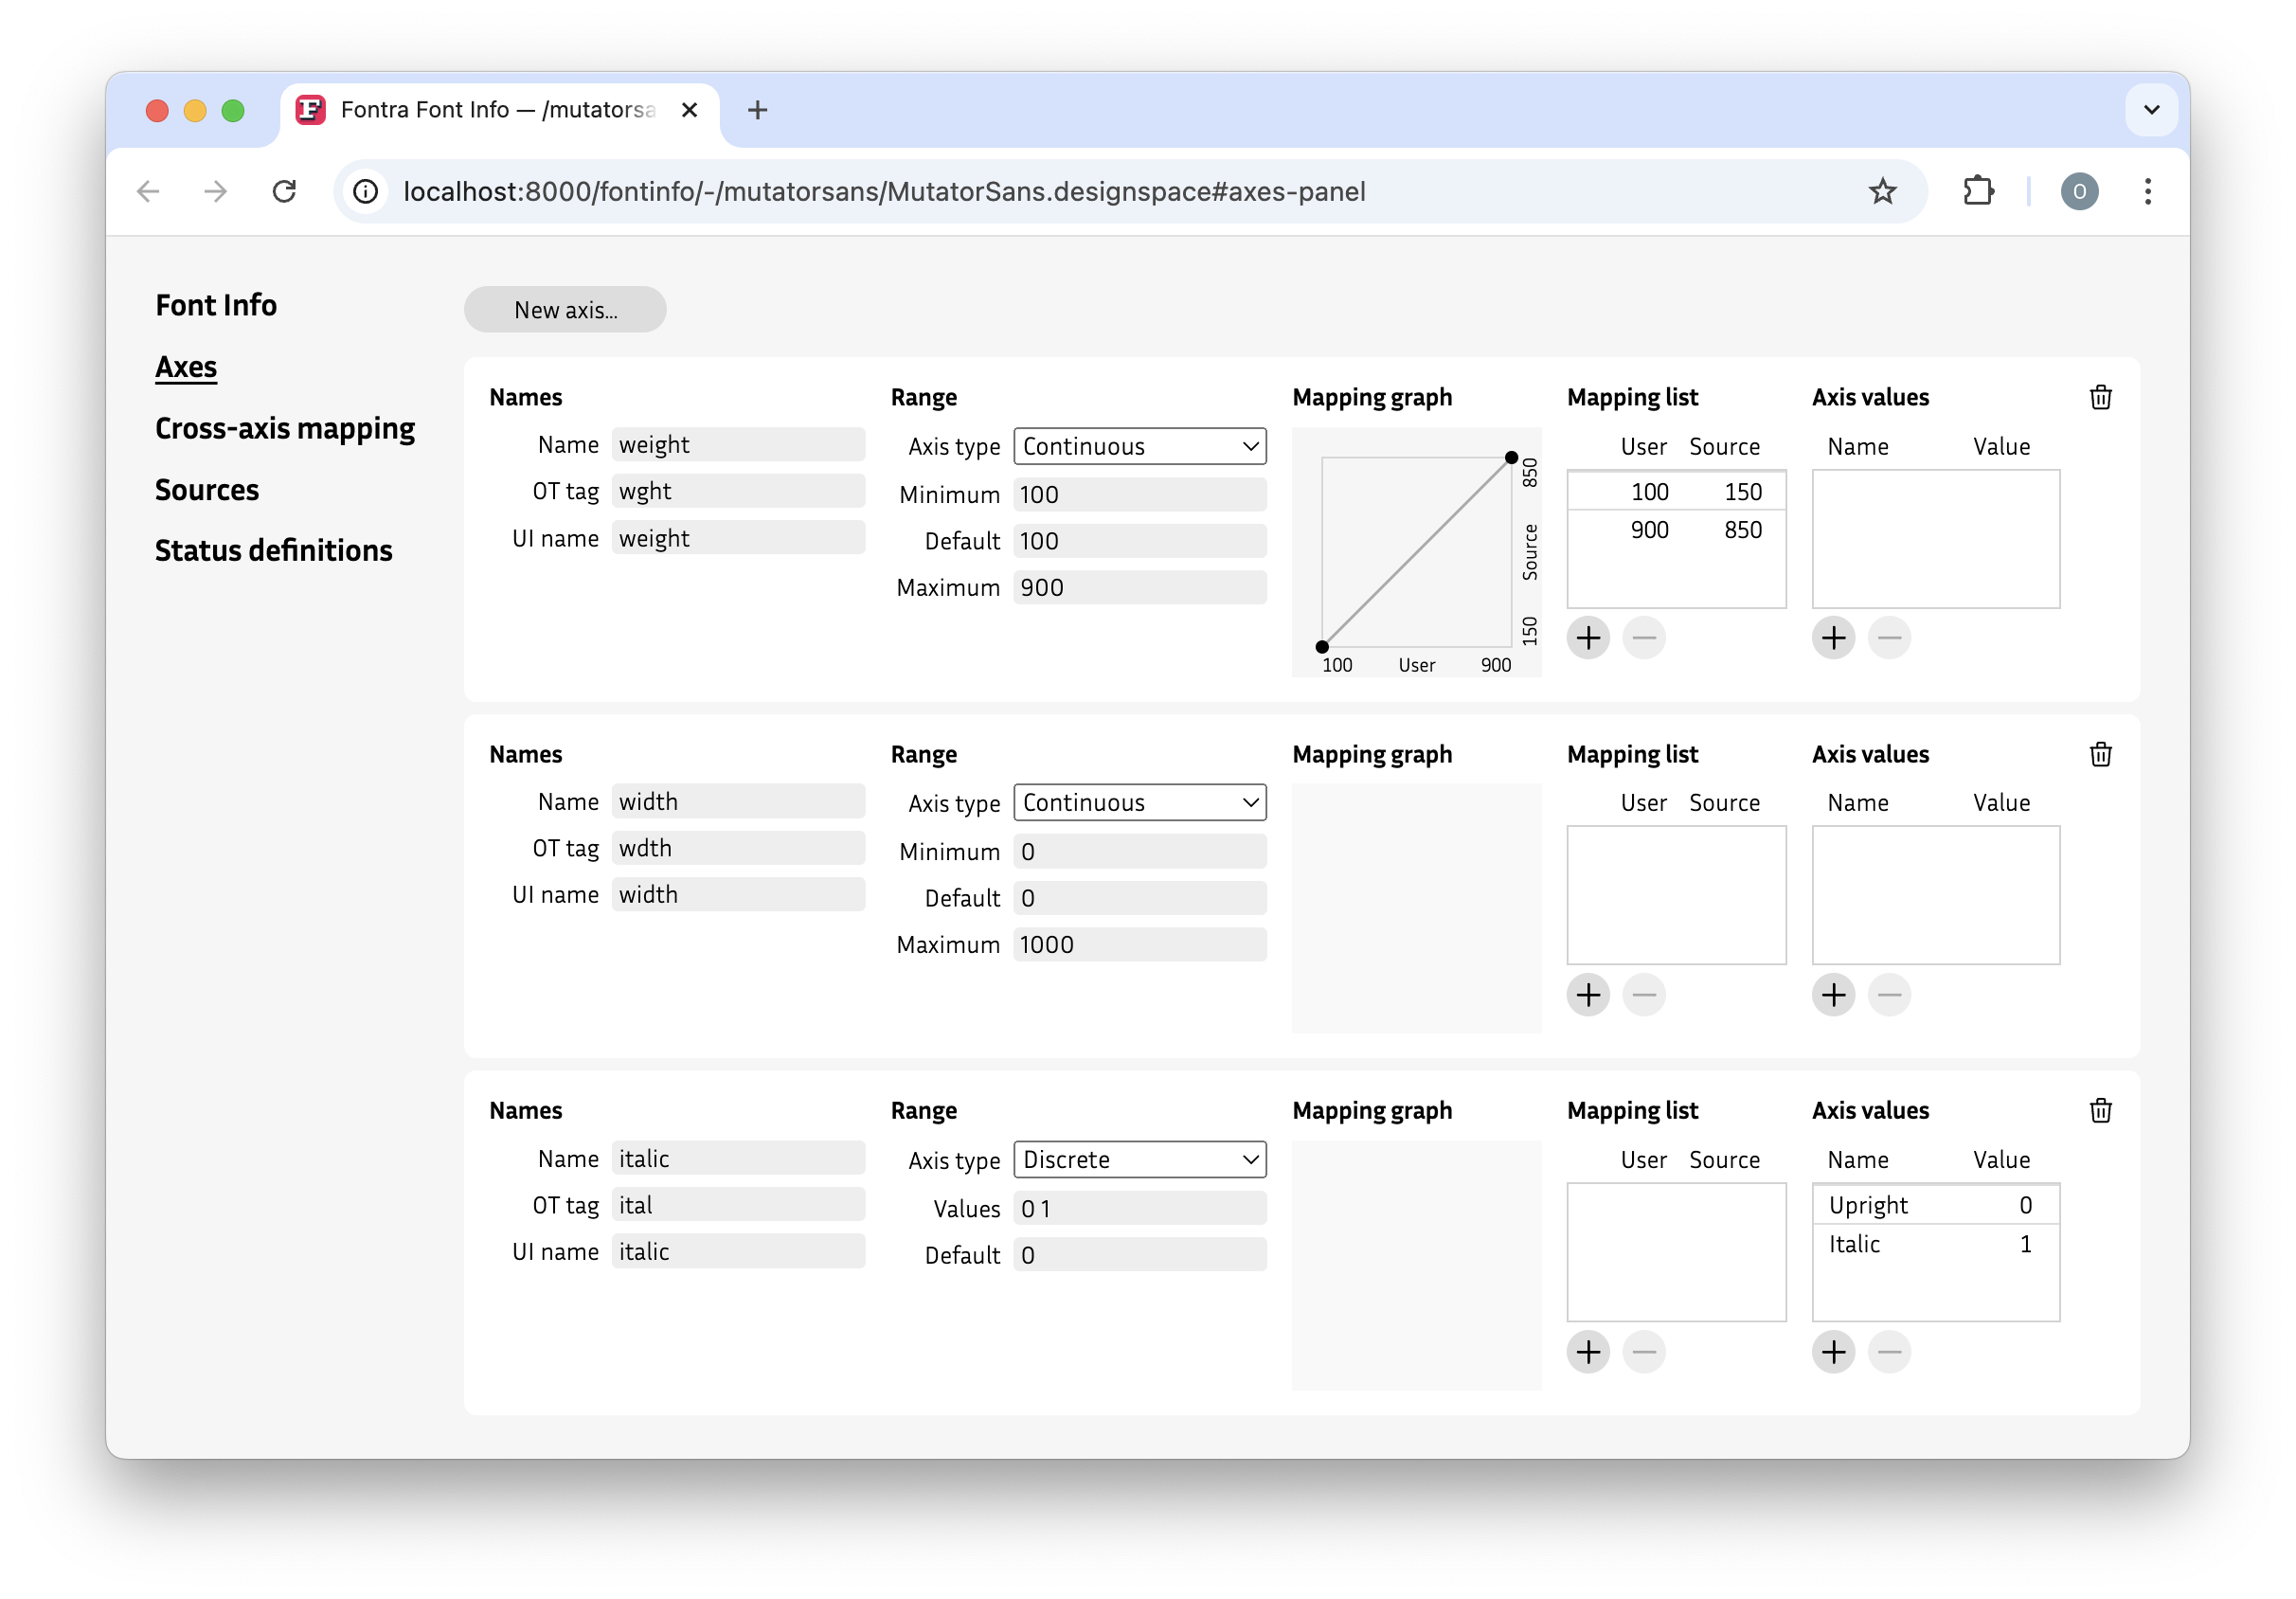
Fontra’s approach is variable-first, therefore it’s most likey that you will add at least one font axis. The most common one is probably Weight. Add a new axis via the New axis… button.
Pro tips:
- Before you create a new axis we recommend to have a look at Designspace, first.
- Change the order of the axes via drag and drop.
- create axis values for each style

Names
| Entry | Description |
|---|---|
| Name¹ | The axis name identifies the axis |
| OT tag | The axis tag must be 4 characters long. Registered OT tags. Non-registered tags must be written in all uppercase. |
| UI Name¹ | UI Name is the Label how it will be visible to the end user |
¹Note: Name and UI Name are often the same.
Range
| Entry | Description |
|---|---|
| Axis Type | Either Continuous² or Discrete³ |
²Range: Axis type Continuous
| Entry | Description |
|---|---|
| Minimum | the minimum value of the axis (for example: 100 for Thin in a Weight axis) |
| Default | the default value of the axis (for example: 400 for Regular in a Weight axis) |
| Maximum | the maximum value of the axis (for example: 900 for Black in a Weight axis) |
³Range: Axis type Discrete
| Entry | Description |
|---|---|
| Values | a list of values for the axis (for example: 0 for Upright and 1 for Italic for Italic axis) |
| Default | the default value of the axis (for example: 0 for Upright in the Italic axis) |
Mapping graph
The mapping graph visualizes the axis mapping.
Mapping list
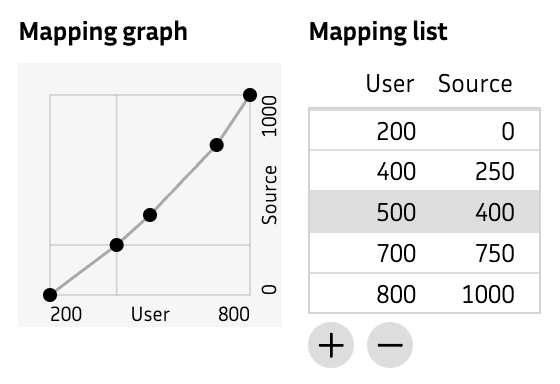
It’s about remapping values -> specify a new mapping of the axis values (also known as avar-mapping or non-linear interpolation). Add a new mapping with the plus-button or remove a mapping with the minus-button.
Example Let’s say, we have a set-up of Weight axis from 0 to 1000 with these values:
- Light: 0
- Regular: 250
- Medium: 400
- Bold: 750
- ExtraBold: 1000
In this case we need a remapping to:
- Light: 200
- Regular: 400
- Medium: 500
- Bold: 700
- ExtraBold: 800
Within the axes panel, this non-linear interpolation would look like this:

Axis Values
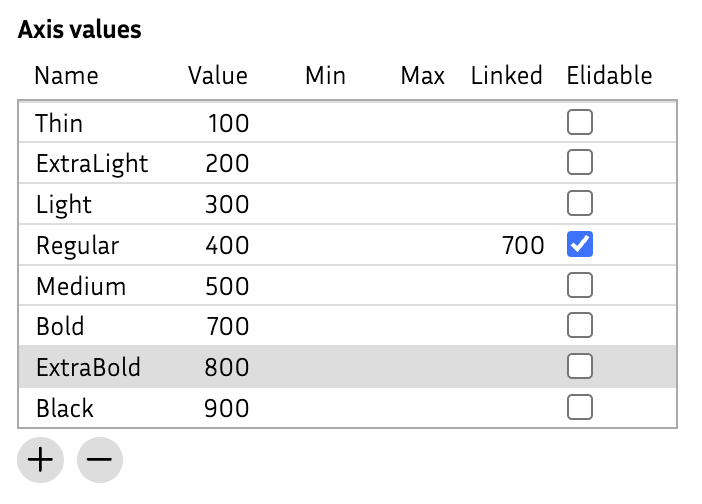
Add a new axis value with plus-button or remove it via minus-button (keyword: STAT table, Example by Microsoft).
NOTE Fontra currently has no direct way to define fvar instances. However, Fontra’s own export will create fvar instances based on axis value labels. So if you have a single weight axis, and add some labels (for example Thin/100, Regular/400, Medium/600 Bold/700), then the export will make fvar instances on those locations. If you have multiple axes, it will make all combinations. For example, if you define Regular/Medium/Bold for weight, and Condensed/Normal/Wide for width, it will create 9 fvar instances.
| Entry | Description |
|---|---|
| Name | The name of a specifed style (for example Regular) |
| Value | The value of a style (for example 400 for Regular) |
| Min | The minumum value of a style (for example 350 for Regular) |
| Max | The maximum value of a style (for example 450 for Regular) |
| Linked | The linked value of a style (for example 700 for Regular, so it's linked with Bold) |
| Elidable | A checkbox which shows that the name should not be displayed (Upright might be an elidable name in the Italic axis) |
Example:
